Analytics is crucial to generating insights that help your organization meet the competitive challenges it faces. On the one hand, emerging digital channels are causing transformational pressures within the banking industry, and on the other hand, competition from new players is increasing the need for accelerating this transformation.
You won’t always have an analytics champion engaged actively during execution. In such a scenario, when defining and executing important initiatives, it is easy to lose sight of analytics, and then attempt to latch it on as an afterthought. This is indeed sub-optimal and will result in slower response times, not to mention a severe impact on the transformation agendas. Insights are needed to validate what has been accomplished, and provide fodder to the initiatives pipeline.
I have found that it is not always feasible to expect the analytics and data management team to chaperon all projects unless they directly relate to the subject. And a checklist item in the governance checklist is easy to get past. This simple framework for analytics can ensure that this important aspect always remains on the top of your radar.
I created the framework in 3 steps.
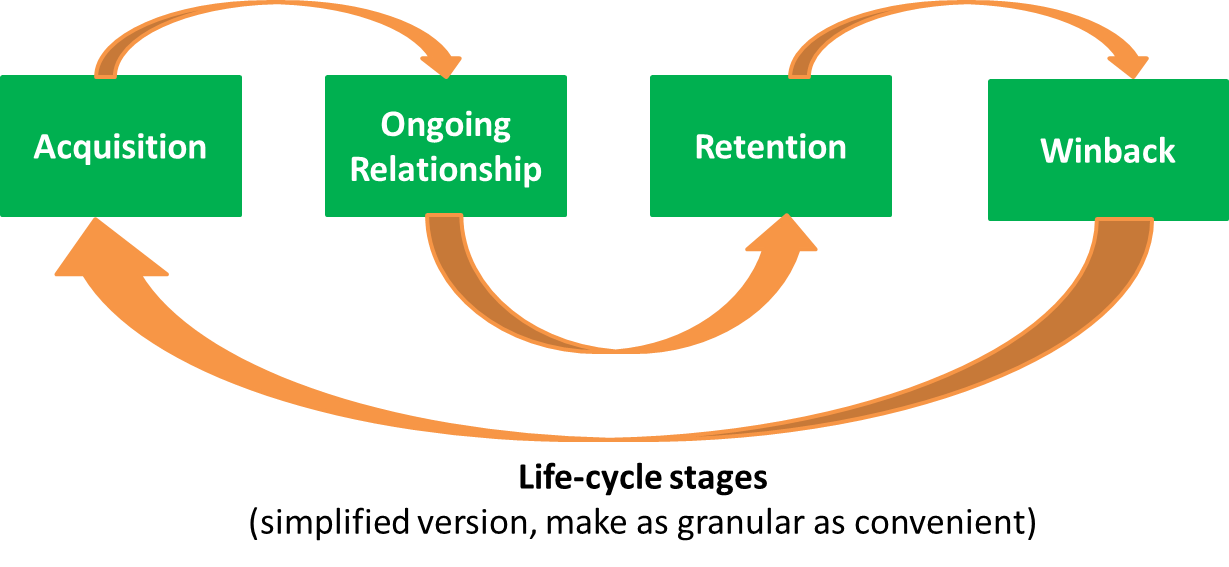
Step 1: Life-cycle processes
You can make this as granular as you find convenient. I find the following life-cycle stages very representative – acquisition, ongoing relationship, retention, win-back. The idea is to model it as logically as possible.
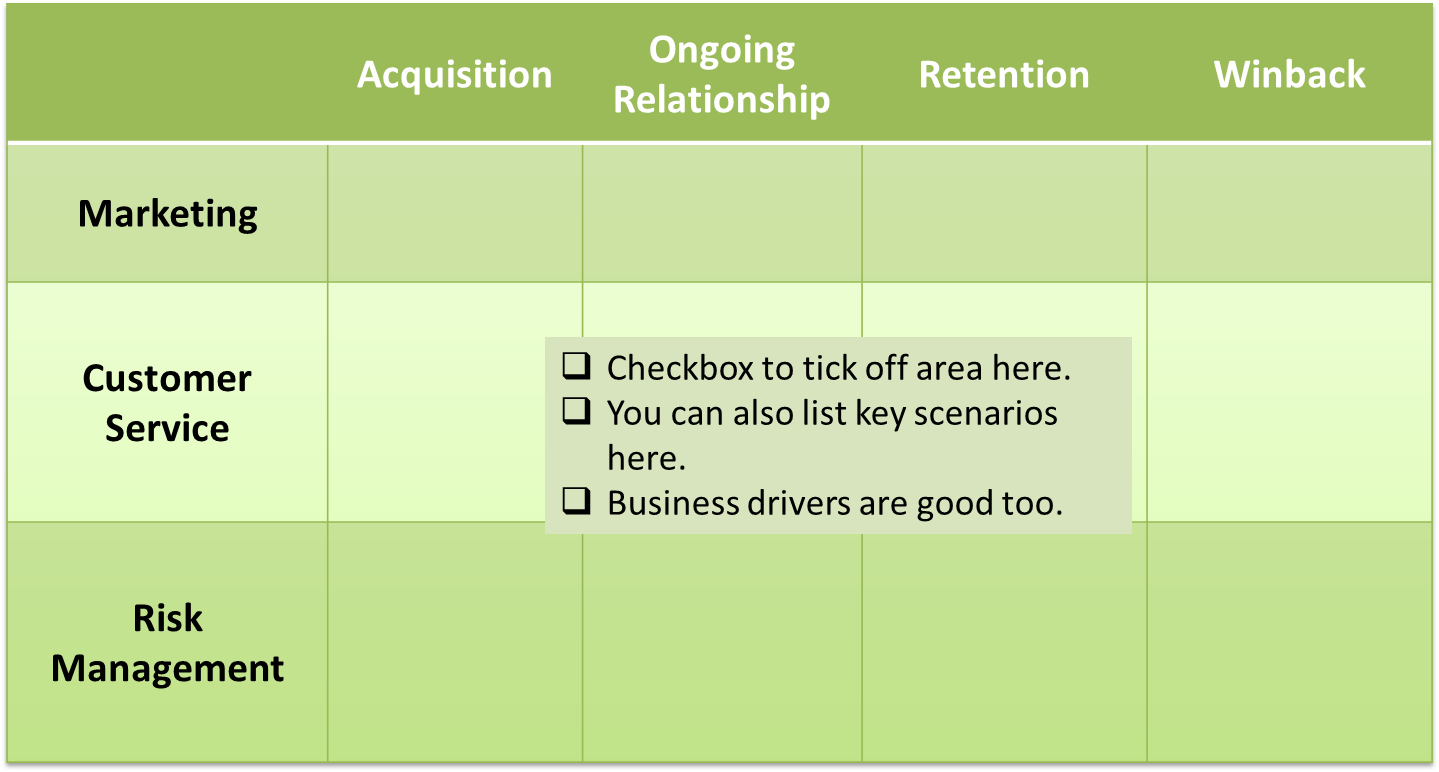
Step 2: Business support areas
 The key areas in my mind are: marketing, customer service and risk management. These support areas are always active in all the life-cycle stages. And each of these has different purposes during the various life-cycle stages.
For example, during acquisition, marketing’s purpose will be to drive calls to action and improve awareness. Customer service will probably help with questions from customers and assist customer to complete the transaction arising from the marketing call to action. Risk management’s purpose is to ensure that the bank’s risk profile is maintained and the guidelines are created appropriately.
Each of these areas will be mapped to each life-cycle stage to provide a complete map of analytical scenarios.
Step 3: Business metrics
This is a listing of the drivers you wish to influence. While it’s OK to start with a list of standard metrics that are always in our mind and that which will come up as you define step 2, viz. retention rates, call handling time, marketing campaign conversion rate etc, I believe that it is best to leave the metrics open to analysis every time you look at the chart. Analytics generates insights, and insights always yield new levers you can influence. In addition, the ongoing operations will always bubble up interesting questions that we should add to our scenario catalog. For example, what helps your calls to action from the Facebook page, or what happens when marketing sends an educational calculator along with their product offer.
Step 4: Enterprisification
I included this because it is often missed as product owners take on the charters to drive their respective P&Ls. Especially in a closely connected industry like banking, its easy for one lever to influence another. Use of debit cards affects credit card metrics, use of CDs affects investing metrics, and the list goes on. It is crucial for banks to address these gaps if they are ward off the impending competition from both banking as well as non-banking players.
I hope this simple tool helps you remember analytics as you execute your transformation roadmaps. Do you have any best practice tips you’d like to suggest?

